|
Image Component Library (ICL)
|
|
Image Component Library (ICL)
|
Easy to use widget component for 2D data visualization. More...
#include <PlotWidget.h>
Classes | |
| struct | SeriesBuffer |
| Utility structure for easier series plots. More... | |
Public Member Functions | |
| PlotWidget (QWidget *parent=0) | |
| Constructor with given parent. | |
| ~PlotWidget () | |
| Destrutor. | |
| void | lock () |
| locks the draw queue | |
| void | unlock () |
| unlocks the draw queue | |
| virtual void | clear () |
| clears the draw queue | |
| void | reset () |
| synonym for clear() | |
| void | label (const std::string &primitiveLabel) |
| sets the legend label for the next scatter-, series- or bar-plot | |
| void | nolabel () |
| calls label("") | |
| void | color (int r, int g, int b, int a=255) |
| sets the line color | |
| template<class VectorType > | |
| void | color (const VectorType &c) |
| convenience macro for types that provide and index operator [] | |
| void | nocolor () |
| sets a fully transparent line color | |
| void | pen (const QPen &pen) |
| sets the line pen | |
| void | fill (int r, int g, int b, int a=255) |
| sets the fill color for series- and bar-plots | |
| template<class VectorType > | |
| void | fill (const VectorType &c) |
| convenience macro for types that provide and index operator [] | |
| void | nofill () |
| sets a fully transparent fill color | |
| void | brush (const QBrush &brush) |
| sets the fill brush | |
| void | sym (char s) |
| sets the current symbol | |
| void | sym (char s, int symsize) |
| sets the current symbol and the symbol size | |
| void | nosym () |
| resets the symbol to ' ' which means no symbols are shown | |
| void | linewidth (float width) |
| sets the linewidth | |
| void | symsize (float size) |
| sets the symbols size | |
| template<class T > | |
| ICLQt_API void | scatter (const T *xs, const T *ys, int num, int xStride=1, int yStride=1, bool connect=false) |
| adds a scatter plot with given x- and y-data pointer | |
| void | scatter (const std::vector< utils::Point32f > &ps, bool connect=false) |
| adds a scatter plot from given vector of points | |
| void | scatter (const std::vector< utils::Point > &ps, bool connect=false) |
| adds a scatter plot from given vector of points | |
| template<class T > | |
| void | scatter (const math::FixedMatrix< T, 1, 2 > *ps, int num, bool connect=false) |
| adds a scatter plot from given set of of fixed vectors | |
| template<class T > | |
| void | scatter (const math::FixedMatrix< T, 2, 1 > *ps, int num, bool connect=false) |
| void | scatter (const std::vector< math::FixedColVector< float, 2 > > &ps, bool connect=false) |
| adds a scatter plot from given vector of fixed vectors | |
| template<class T > | |
| ICLQt_API void | series (const T *data, int num, int stride=1) |
| adds series data | |
| template<class T > | |
| void | series (const std::vector< T > &data) |
| adds series data from given std::vector | |
| template<class T > | |
| ICLQt_API void | bars (const T *data, int num, int stride=1) |
| adds bar plot data | |
| template<class T > | |
| void | bars (const std::vector< T > &data) |
| adds bar plot data from given std::vector | |
| void | line (const utils::Point32f &a, const utils::Point32f &b) |
| draws a line annotation using the current color | |
| void | line (float x1, float y1, float x2, float y2) |
| draws a line annotation given 4 coordinates | |
| void | linestrip (const std::vector< utils::Point32f > &ps, bool closedLoop=true) |
| draws a line strip annotation | |
| void | linestrip (const std::vector< utils::Point > &ps, bool closedLoop=true) |
| draws a line strip annotation | |
| void | linestrip (const utils::Point32f *ps, int num, bool closedLoop=true) |
| draws a line strip annotation | |
| void | linestrip (const utils::Point *ps, int num, bool closedLoop=true) |
| draws a line strip annotation | |
| void | linestrip (const float *xs, const float *ys, int num, bool closedLoop=true, int stride=1) |
| draws a line strip annotation | |
| void | rect (const utils::Point32f &ul, const utils::Point32f &lr) |
| draws a rectangle annotation with given upper left and lower right coordinate | |
| void | rect (const utils::Rect &r) |
| draws a rectangle annotation | |
| void | rect (const utils::Rect32f &r) |
| draws a rectangle annotation | |
| void | rect (float x, float y, float w, float h) |
| draws a rectangle annotation | |
| void | circle (const utils::Point32f &c, float r) |
| draws a circle annotation | |
| void | circle (float cx, float cy, float r) |
| draws a circle annotation | |
| void | text (float x, float y, const std::string &text) |
| draws a text annotation | |
| void | text (const utils::Point32f &p, const std::string &text) |
| draws a text annotation | |
| void | grid (int nX, int nY, const float *xs, const float *ys, int stride=1) |
| draws a grid-annoation | |
| void | grid (const utils::Array2D< utils::Point > &data) |
| draws a grid-annoation | |
| void | grid (const utils::Array2D< utils::Point32f > &data) |
| draws a grid-annoation | |
| void | grid (int nX, int nY, const float *xys) |
| draws a grid-annoation | |
| void | grid (int nX, int nY, const utils::Point *ps) |
| draws a grid-annoation | |
| void | grid (int nX, int nY, const utils::Point32f *ps) |
| draws a grid-annoation | |
| void | grid (int nX, int nY, const std::vector< utils::Point32f > &ps) |
| draws a grid-annoation | |
| void | grid (int nX, int nY, const std::vector< utils::Point > &ps) |
| draws a grid-annoation | |
| void | grid (int nX, int nY, const std::vector< float > &xys) |
| draws a grid-annoation | |
| void | grid (int nX, int nY, const std::vector< float > &xs, const std::vector< float > &ys) |
| draws a grid-annoation | |
| void | draw (const utils::VisualizationDescription &d) |
| draws a VisualizationDescription instance | |
| void | title (const std::string &title) |
| sets the diagram title | |
| void | xlabel (const std::string &xlabel) |
| sets the x-axis label | |
| void | ylabel (const std::string &ylabel) |
| sets the y-axis label | |
Private Attributes | |
| Data * | m_data |
| internal data structure | |
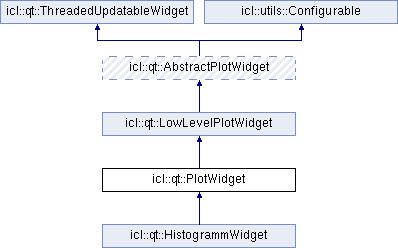
Easy to use widget component for 2D data visualization.
In contrast to it's parent class icl::LowLevelPlotWidget, the icl::PlotWidget interface is allinged with ICL's 2D image annotation framework (see icl::ICLDrawWidget).
The PlotWidget has two types of content:
Only plotting data is used for automatic view-port estimation.
The PlotWidget internally uses a synchronized queue of darw commands. Draw commands can only added in a thread-safe manner if the PlotWidget is locked (see PlotWidget::lock() and PlotWidget::unlock() ). The PlotWidget does not support to reference to be visualized data using a shallow/pointer copy. Instead, the given data is always copied deeply into an internal buffer. By theses means, given data must not be kept in memory or synchronized mannually. While locked, the following operations for data visualization are available:
For annotation data, the following basic methods are provided. Again, for each of these, several convience methods are also available.
The methods, PlotWidget::title, PlotWidget::xlabel and PlotWidget::ylabel are just convenience function that use the derived Configurable's Configurable::setPropertyValue method in a direct manner.
The plot widget is also a component of ICL's icl::GUI framework. The component tag is "plot" its parameters are
Example:
        // create some data
        std::vector<float> sinData(100);
        for(float i=0;i<100;++i){
          sinData[i] = sin(i/100 * 2*M_PI);
        }

        GUI gui;
        gui << Plot(0,6.283,-1.1,1.1).handle("plot").minSize(20,20) << Show();

        // extract the handle
        PlotHandle plot = gui["plot"];

        plot->lock();            // lock the draw queue
        plot->color(255,0,0);    // set graph line color
        plot->fill(255,0,0,100); // set graph fill (semi transparent)
        plot->label("sin(x)");   // set the legend label
        plot->series(sinData);   // add data to visualize
        plot->unlock();          // unlock the draw queue
        plot.render();           // post an update event to Qt
Soon!*
| icl::qt::PlotWidget::PlotWidget | ( | QWidget * | parent = 0 | ) |
Constructor with given parent.
Usually, the
Destrutor.
| ICLQt_API void icl::qt::PlotWidget::bars | ( | const T * | data, |
| int | num, | ||
| int | stride = 1 |
||
| ) |
adds bar plot data
| data | data pointer |
| num | number of elements |
| stride | data increment to iterate through the data elements stride is given in sizeof(float) units |
| void icl::qt::PlotWidget::bars | ( | const std::vector< T > & | data | ) | [inline] |
adds bar plot data from given std::vector
| void icl::qt::PlotWidget::brush | ( | const QBrush & | brush | ) |
sets the fill brush
This is more powerful then just setting the fill color using PlotWidget::fill. The brush overwrites the current fill color setting. In contrast to PlotWidget::fill, the brush can also be set up to fill areas with a given pattern
| void icl::qt::PlotWidget::circle | ( | const utils::Point32f & | c, |
| float | r | ||
| ) |
draws a circle annotation
| void icl::qt::PlotWidget::circle | ( | float | cx, |
| float | cy, | ||
| float | r | ||
| ) |
draws a circle annotation
| virtual void icl::qt::PlotWidget::clear | ( | ) | [virtual] |
clears the draw queue
Reimplemented from icl::qt::LowLevelPlotWidget.
| void icl::qt::PlotWidget::color | ( | int | r, |
| int | g, | ||
| int | b, | ||
| int | a = 255 |
||
| ) |
sets the line color
| void icl::qt::PlotWidget::color | ( | const VectorType & | c | ) | [inline] |
convenience macro for types that provide and index operator []
Please note, that c needs 4 elements at least.
| void icl::qt::PlotWidget::draw | ( | const utils::VisualizationDescription & | d | ) |
draws a VisualizationDescription instance
Internally, the description is decomposed to normal function calls
| void icl::qt::PlotWidget::fill | ( | int | r, |
| int | g, | ||
| int | b, | ||
| int | a = 255 |
||
| ) |
sets the fill color for series- and bar-plots
The fill color is also used for rect- and circle annotations
| void icl::qt::PlotWidget::fill | ( | const VectorType & | c | ) | [inline] |
convenience macro for types that provide and index operator []
Please note, that c needs 4 elements at least.
| void icl::qt::PlotWidget::grid | ( | int | nX, |
| int | nY, | ||
| const float * | xs, | ||
| const float * | ys, | ||
| int | stride = 1 |
||
| ) |
draws a grid-annoation
| void icl::qt::PlotWidget::grid | ( | const utils::Array2D< utils::Point > & | data | ) |
draws a grid-annoation
| void icl::qt::PlotWidget::grid | ( | const utils::Array2D< utils::Point32f > & | data | ) | [inline] |
draws a grid-annoation
| void icl::qt::PlotWidget::grid | ( | int | nX, |
| int | nY, | ||
| const float * | xys | ||
| ) | [inline] |
draws a grid-annoation
| void icl::qt::PlotWidget::grid | ( | int | nX, |
| int | nY, | ||
| const utils::Point * | ps | ||
| ) | [inline] |
draws a grid-annoation
| void icl::qt::PlotWidget::grid | ( | int | nX, |
| int | nY, | ||
| const utils::Point32f * | ps | ||
| ) | [inline] |
draws a grid-annoation
| void icl::qt::PlotWidget::grid | ( | int | nX, |
| int | nY, | ||
| const std::vector< utils::Point32f > & | ps | ||
| ) | [inline] |
draws a grid-annoation
| void icl::qt::PlotWidget::grid | ( | int | nX, |
| int | nY, | ||
| const std::vector< utils::Point > & | ps | ||
| ) | [inline] |
draws a grid-annoation
| void icl::qt::PlotWidget::grid | ( | int | nX, |
| int | nY, | ||
| const std::vector< float > & | xys | ||
| ) | [inline] |
draws a grid-annoation
| void icl::qt::PlotWidget::grid | ( | int | nX, |
| int | nY, | ||
| const std::vector< float > & | xs, | ||
| const std::vector< float > & | ys | ||
| ) | [inline] |
draws a grid-annoation
| void icl::qt::PlotWidget::label | ( | const std::string & | primitiveLabel | ) |
sets the legend label for the next scatter-, series- or bar-plot
| void icl::qt::PlotWidget::line | ( | const utils::Point32f & | a, |
| const utils::Point32f & | b | ||
| ) |
draws a line annotation using the current color
| void icl::qt::PlotWidget::line | ( | float | x1, |
| float | y1, | ||
| float | x2, | ||
| float | y2 | ||
| ) | [inline] |
draws a line annotation given 4 coordinates
| void icl::qt::PlotWidget::linestrip | ( | const std::vector< utils::Point32f > & | ps, |
| bool | closedLoop = true |
||
| ) |
draws a line strip annotation
| void icl::qt::PlotWidget::linestrip | ( | const std::vector< utils::Point > & | ps, |
| bool | closedLoop = true |
||
| ) |
draws a line strip annotation
| void icl::qt::PlotWidget::linestrip | ( | const utils::Point32f * | ps, |
| int | num, | ||
| bool | closedLoop = true |
||
| ) |
draws a line strip annotation
| void icl::qt::PlotWidget::linestrip | ( | const utils::Point * | ps, |
| int | num, | ||
| bool | closedLoop = true |
||
| ) |
draws a line strip annotation
| void icl::qt::PlotWidget::linestrip | ( | const float * | xs, |
| const float * | ys, | ||
| int | num, | ||
| bool | closedLoop = true, |
||
| int | stride = 1 |
||
| ) |
draws a line strip annotation
| void icl::qt::PlotWidget::linewidth | ( | float | width | ) |
sets the linewidth
| void icl::qt::PlotWidget::lock | ( | ) | [inline] |
locks the draw queue
| void icl::qt::PlotWidget::nocolor | ( | ) | [inline] |
sets a fully transparent line color
| void icl::qt::PlotWidget::nofill | ( | ) | [inline] |
sets a fully transparent fill color
| void icl::qt::PlotWidget::nolabel | ( | ) | [inline] |
calls label("")
| void icl::qt::PlotWidget::nosym | ( | ) | [inline] |
resets the symbol to ' ' which means no symbols are shown
| void icl::qt::PlotWidget::pen | ( | const QPen & | pen | ) |
sets the line pen
This overwrites the current setting for linewidth and color. The pen can e.g. be used to draw dashed lines.
| void icl::qt::PlotWidget::rect | ( | const utils::Point32f & | ul, |
| const utils::Point32f & | lr | ||
| ) |
draws a rectangle annotation with given upper left and lower right coordinate
| void icl::qt::PlotWidget::rect | ( | const utils::Rect & | r | ) |
draws a rectangle annotation
| void icl::qt::PlotWidget::rect | ( | const utils::Rect32f & | r | ) |
draws a rectangle annotation
| void icl::qt::PlotWidget::rect | ( | float | x, |
| float | y, | ||
| float | w, | ||
| float | h | ||
| ) |
draws a rectangle annotation
| void icl::qt::PlotWidget::reset | ( | ) | [inline] |
synonym for clear()
| ICLQt_API void icl::qt::PlotWidget::scatter | ( | const T * | xs, |
| const T * | ys, | ||
| int | num, | ||
| int | xStride = 1, |
||
| int | yStride = 1, |
||
| bool | connect = false |
||
| ) |
adds a scatter plot with given x- and y-data pointer
| xs | source pointer for the x-values |
| ys | source poitner for the y-value |
| num | number of points |
| xStride | pointer increment to to iterate through the elements of xs (in sizeof(float) units) |
| yStride | pointer increment to to iterate through the elements of ys (in sizeof(float) units) |
| connect | if set to true, successive points are connected using a line |
| void icl::qt::PlotWidget::scatter | ( | const std::vector< utils::Point32f > & | ps, |
| bool | connect = false |
||
| ) | [inline] |
adds a scatter plot from given vector of points
| void icl::qt::PlotWidget::scatter | ( | const std::vector< utils::Point > & | ps, |
| bool | connect = false |
||
| ) | [inline] |
adds a scatter plot from given vector of points
| void icl::qt::PlotWidget::scatter | ( | const math::FixedMatrix< T, 1, 2 > * | ps, |
| int | num, | ||
| bool | connect = false |
||
| ) | [inline] |
adds a scatter plot from given set of of fixed vectors
| void icl::qt::PlotWidget::scatter | ( | const math::FixedMatrix< T, 2, 1 > * | ps, |
| int | num, | ||
| bool | connect = false |
||
| ) | [inline] |
| void icl::qt::PlotWidget::scatter | ( | const std::vector< math::FixedColVector< float, 2 > > & | ps, |
| bool | connect = false |
||
| ) | [inline] |
adds a scatter plot from given vector of fixed vectors
| ICLQt_API void icl::qt::PlotWidget::series | ( | const T * | data, |
| int | num, | ||
| int | stride = 1 |
||
| ) |
adds series data
| data | data pointer |
| num | number of elements |
| stride | data increment to iterate through the data elements stride is given in sizeof(float) units |
| void icl::qt::PlotWidget::series | ( | const std::vector< T > & | data | ) | [inline] |
adds series data from given std::vector
| void icl::qt::PlotWidget::sym | ( | char | s | ) |
sets the current symbol
The symbol is used for series and scatter plots
| void icl::qt::PlotWidget::sym | ( | char | s, |
| int | symsize | ||
| ) | [inline] |
sets the current symbol and the symbol size
The symbol size is always given in pixels
| void icl::qt::PlotWidget::symsize | ( | float | size | ) |
sets the symbols size
| void icl::qt::PlotWidget::text | ( | float | x, |
| float | y, | ||
| const std::string & | text | ||
| ) |
draws a text annotation
Note.: the text anchor is always centered)
| void icl::qt::PlotWidget::text | ( | const utils::Point32f & | p, |
| const std::string & | text | ||
| ) |
draws a text annotation
Note.: the text anchor is always centered)
| void icl::qt::PlotWidget::title | ( | const std::string & | title | ) | [inline] |
sets the diagram title
Please note, that usually the property "borders.top" needs to be set to something around 18. Otherwise, the tiltle is placed within the drawing area
| void icl::qt::PlotWidget::unlock | ( | ) | [inline] |
unlocks the draw queue
| void icl::qt::PlotWidget::xlabel | ( | const std::string & | xlabel | ) | [inline] |
sets the x-axis label
| void icl::qt::PlotWidget::ylabel | ( | const std::string & | ylabel | ) | [inline] |
sets the y-axis label
Data* icl::qt::PlotWidget::m_data [private] |
internal data structure
internal data (pimpl)
 1.7.6.1

